
 Français
 Deutsch
 Italiano
 Português
 Español
Configure the monitoring policy for each device
For each device you activate on the Devices Activation page, you can enable the Monitoring function, which allows you to define monitoring policies, i.e. to set parameters for evaluating the health of your computers, and assign them to your devices. Based on the policies you have configured, you get customized error or warning notifications of performance or security problems on the computers you monitor.
Under RMM – Monitoring you can view all current notifications for monitored devices.
To manage your policies, click on Manage Monitoring Policies: you can immediately see the list of policies already configured and the parameters set in each of them.
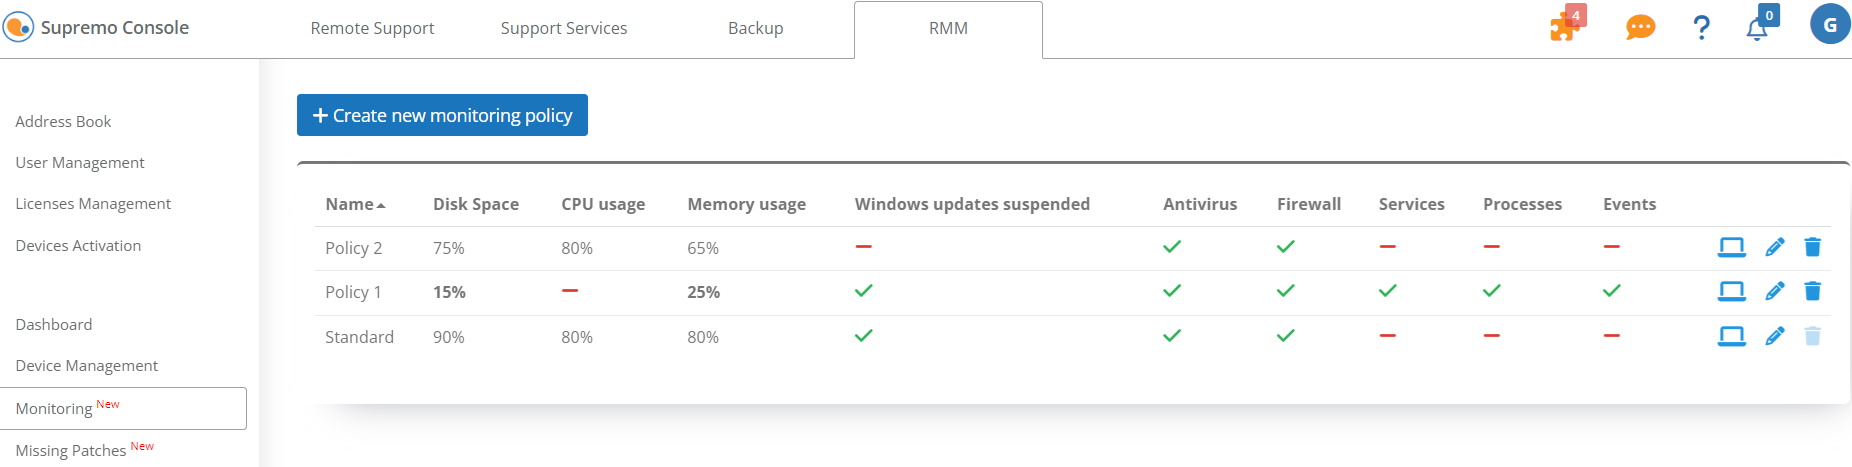
The parameters that can be managed in the policies, which generate error and warning notifications, are:
- Maximum percentage of disk space used (error notification)
- Maximum percentage of CPU usage (error notification)
- Maximum percentage of memory usage (error notification)
- Enable/Disable notifications for Suspended Windows Updates (warning notification)
- Activate/Deactivate notifications for existing Antivirus software (warning notification)
- Activate/Deactivate notifications for existing Firewalls (warning notification)
- Notifications settings for Windows Services interruption (warning notification)
- Notifications settings for running or non-running Windows Processes (warning notification)
- Notifications settings for Events detected in Windows Logs: Application, System and Security (warning notification)
Each new activated device is automatically assigned the standard policy with some predefined parameters. However, you can modify and customize the standard policy to suit your needs, also adding monitoring of specific Windows services, processes or events.
You can also add new policies, defining different parameters and receiving customized notifications for each of them.
In the monitoring policy management, you can create a new policy, modify or delete an existing policy and associate devices with policies.
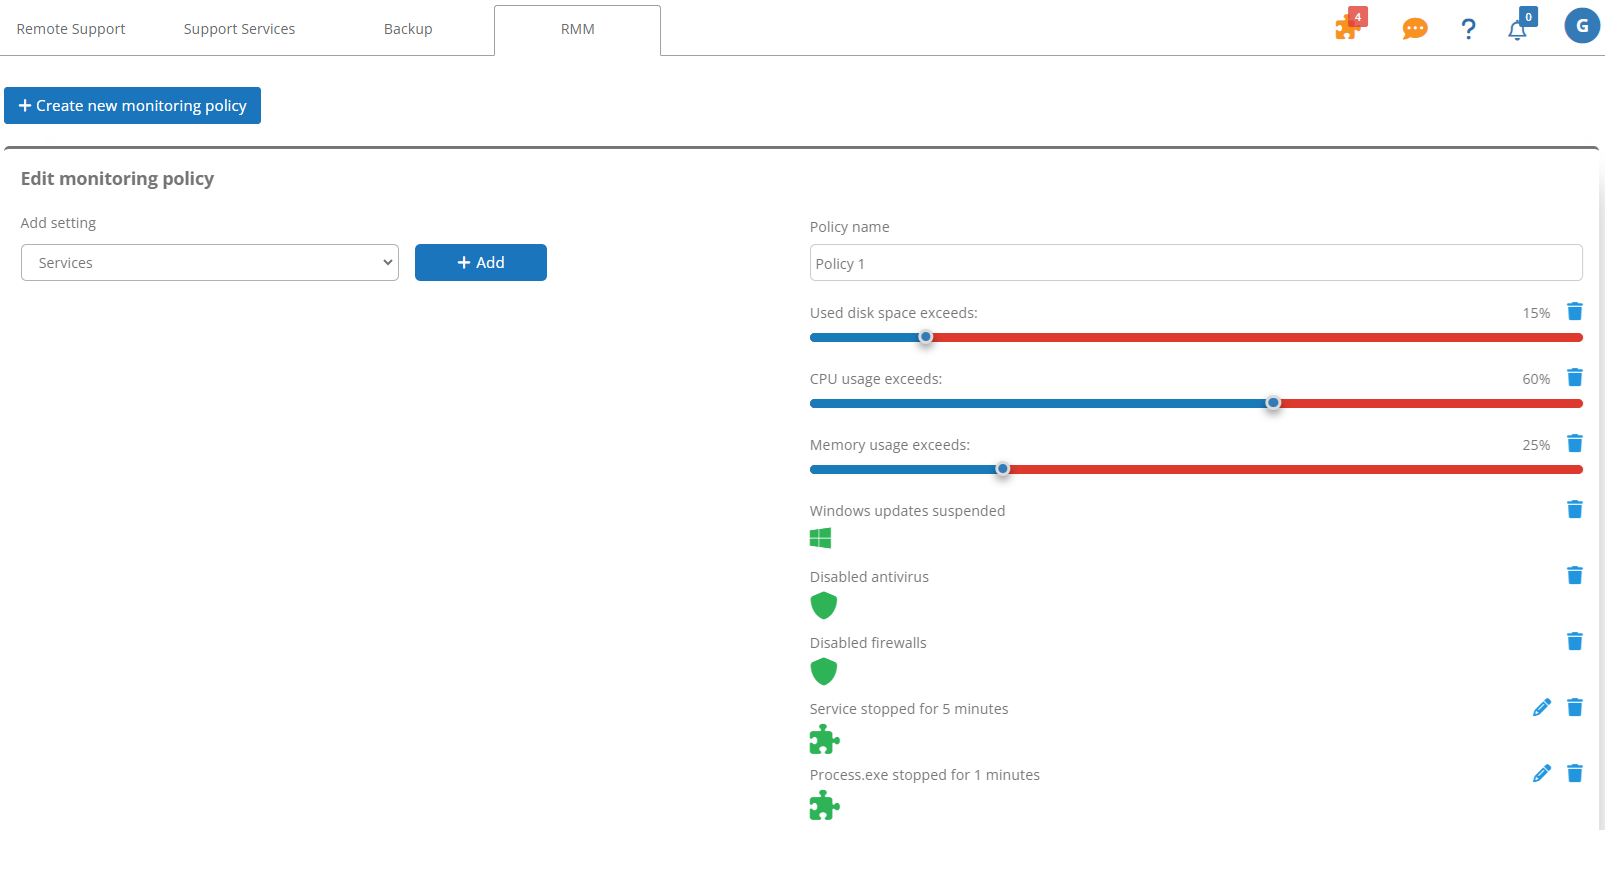
Creating a new policy
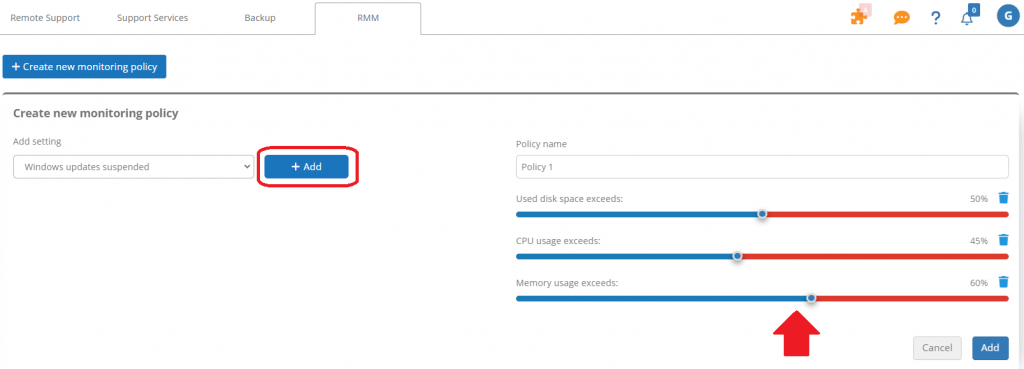
Click on Create new monitoring policy and enter a name.
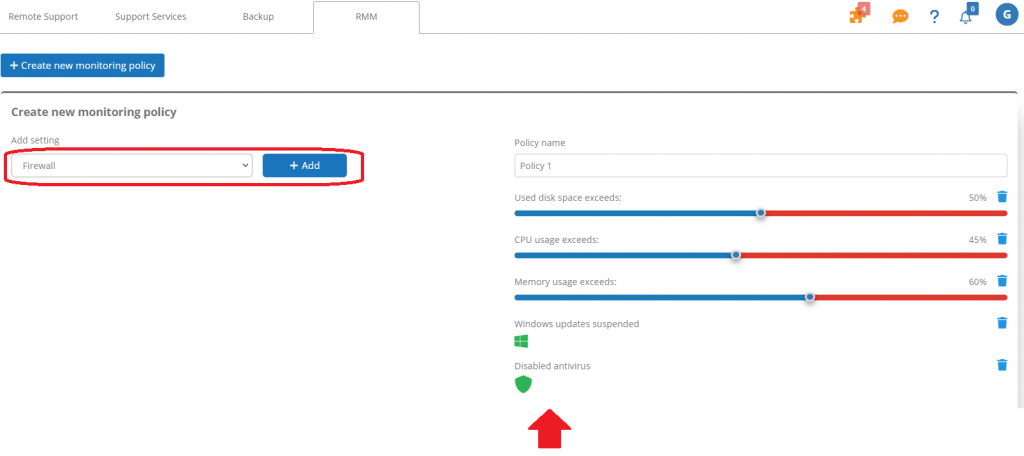
Policy parameters are added by selecting them in the drop-down menu and clicking on the Add button.
For disk space, CPU usage and memory usage notifications, after adding them, you can choose the percentage above which you wish to be notified.
For disabled antivirus and firewalls and suspended Windows updates, simply add the desired parameters to the policy.
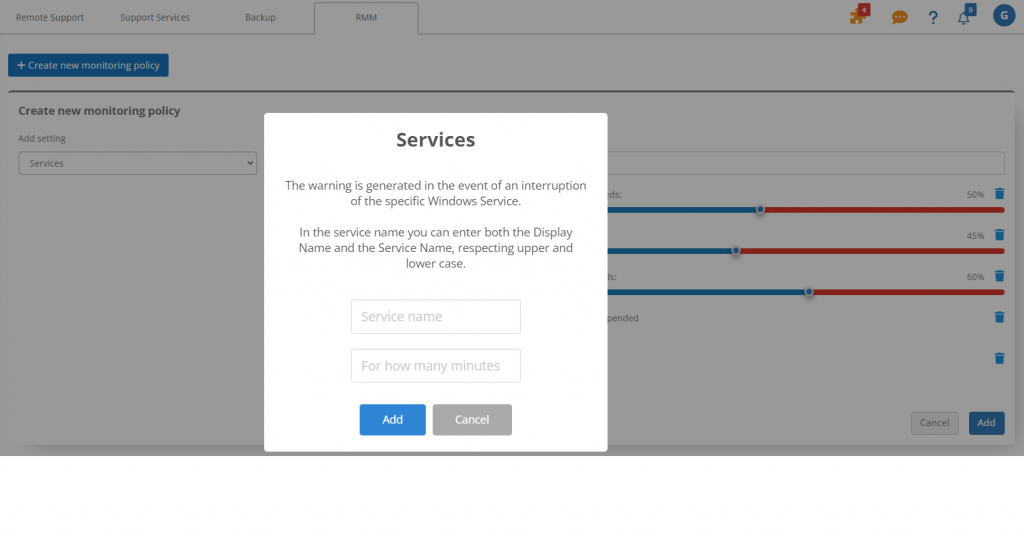
As far as Windows services are concerned, it is possible to receive a notification if a specific service is interrupted and no longer running.
For each service that you wish to monitor, you need to enter:
- the name, which must be the same as the one displayed in the Windows Task Manager. Both the Display Name and the Service Name can be entered, respecting upper and lower case letters;
- the minutes of interruption, i.e. the time after which you want to receive the notification.
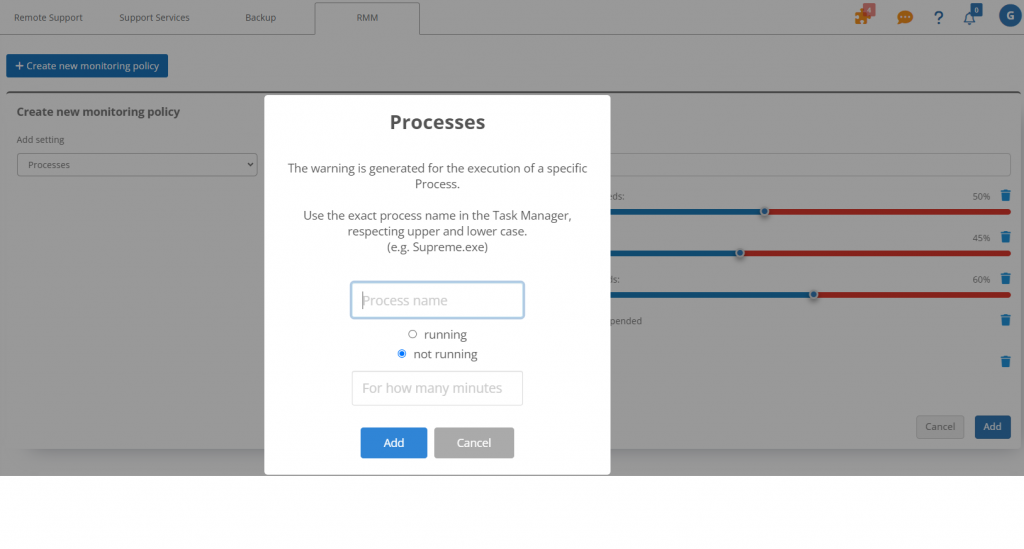
For each process to be monitored, you have to enter:
- the name, which must be the same as the one displayed in the Windows Task Manager, respecting upper and lower case letters;
- whether you want to be notified when a process is running or not;
- the minutes of interruption, i.e. the time after which you want to receive the notification.
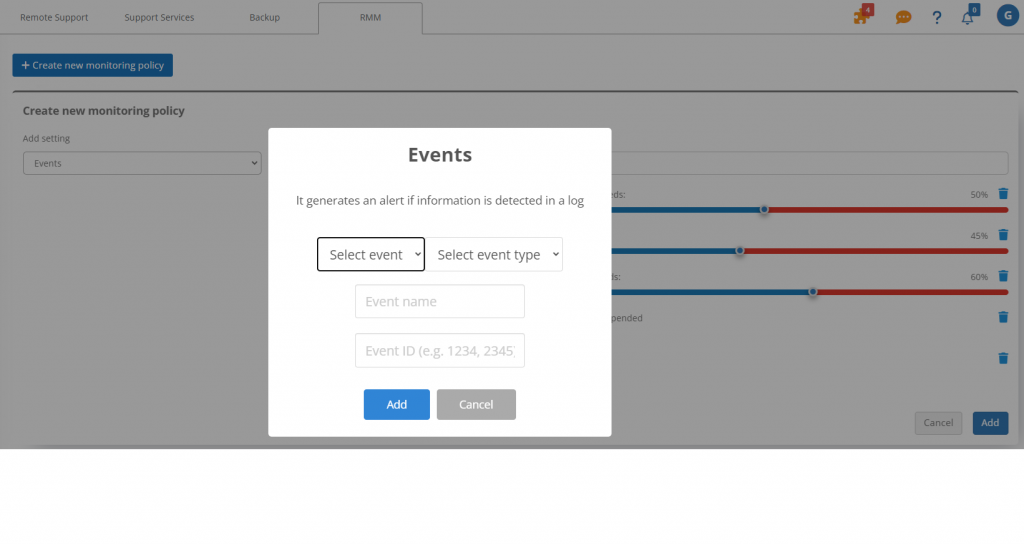
For each event to be monitored, you need to indicate:
- the event, i.e. the Windows registry by selecting between Application, System and Security;
- the type of event, i.e. information, error, warning, audit success and audit failure;
- the name of the event, which you can choose as you wish;
- the Windows event ID.
Assigning policies to devices and monitoring
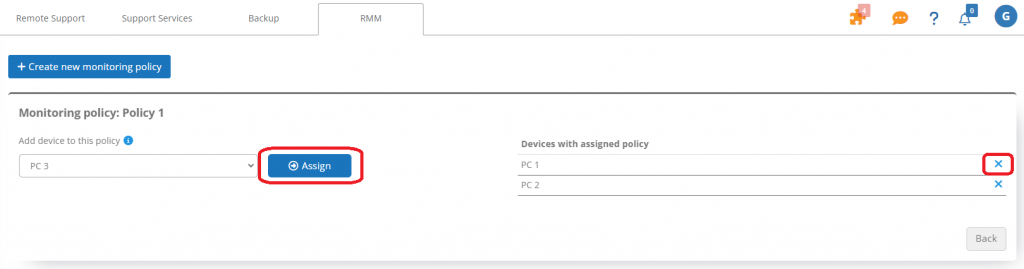
After you have configured your policies, you can proceed to assign devices, by clicking on the PC icon in the row of the policy to be managed.
Simply click on assign to assign the device to the policy.
To delete assignments already made, just click on the X symbol to the right of the device. If deleted, the standard policy is automatically assigned.
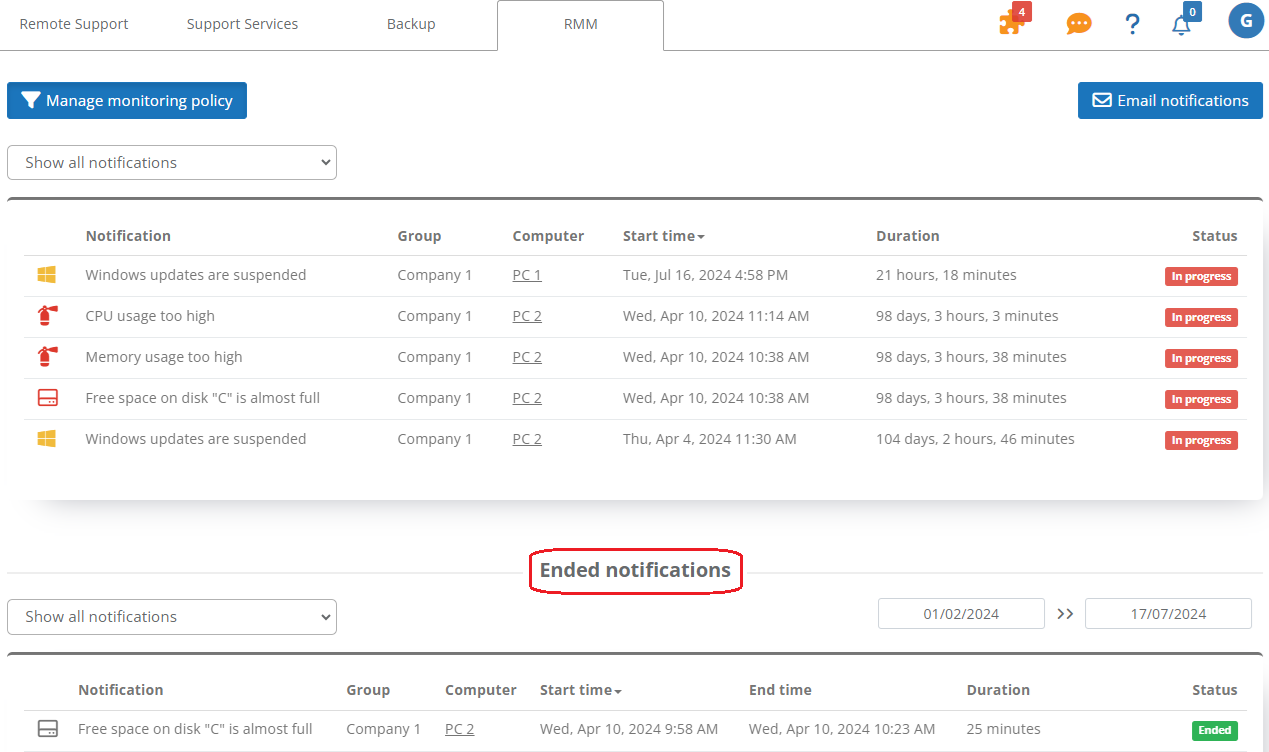
Based on what is defined in the policy, the error or warning notifications that you see in the first table are generated.
Error notifications relating to performance problems are shown in red.
Warnings relating to security problems (disabled antivirus or firewall, monitoring of services, processes and events) are shown in yellow.
For each notification, you can see the indication of its duration, i.e. how long the notification has been in progress.
When a reported problem is no longer present (e.g. following specific interventions on the PC or after a service has returned to operation), the notification is automatically moved to the history.
In the history of ended notifications, you can carry out customised searches by type of notification and time period.
For a general summary of the health status of all your devices, you can access the Dashboard in the RMM area.