Access the control panel of your devices
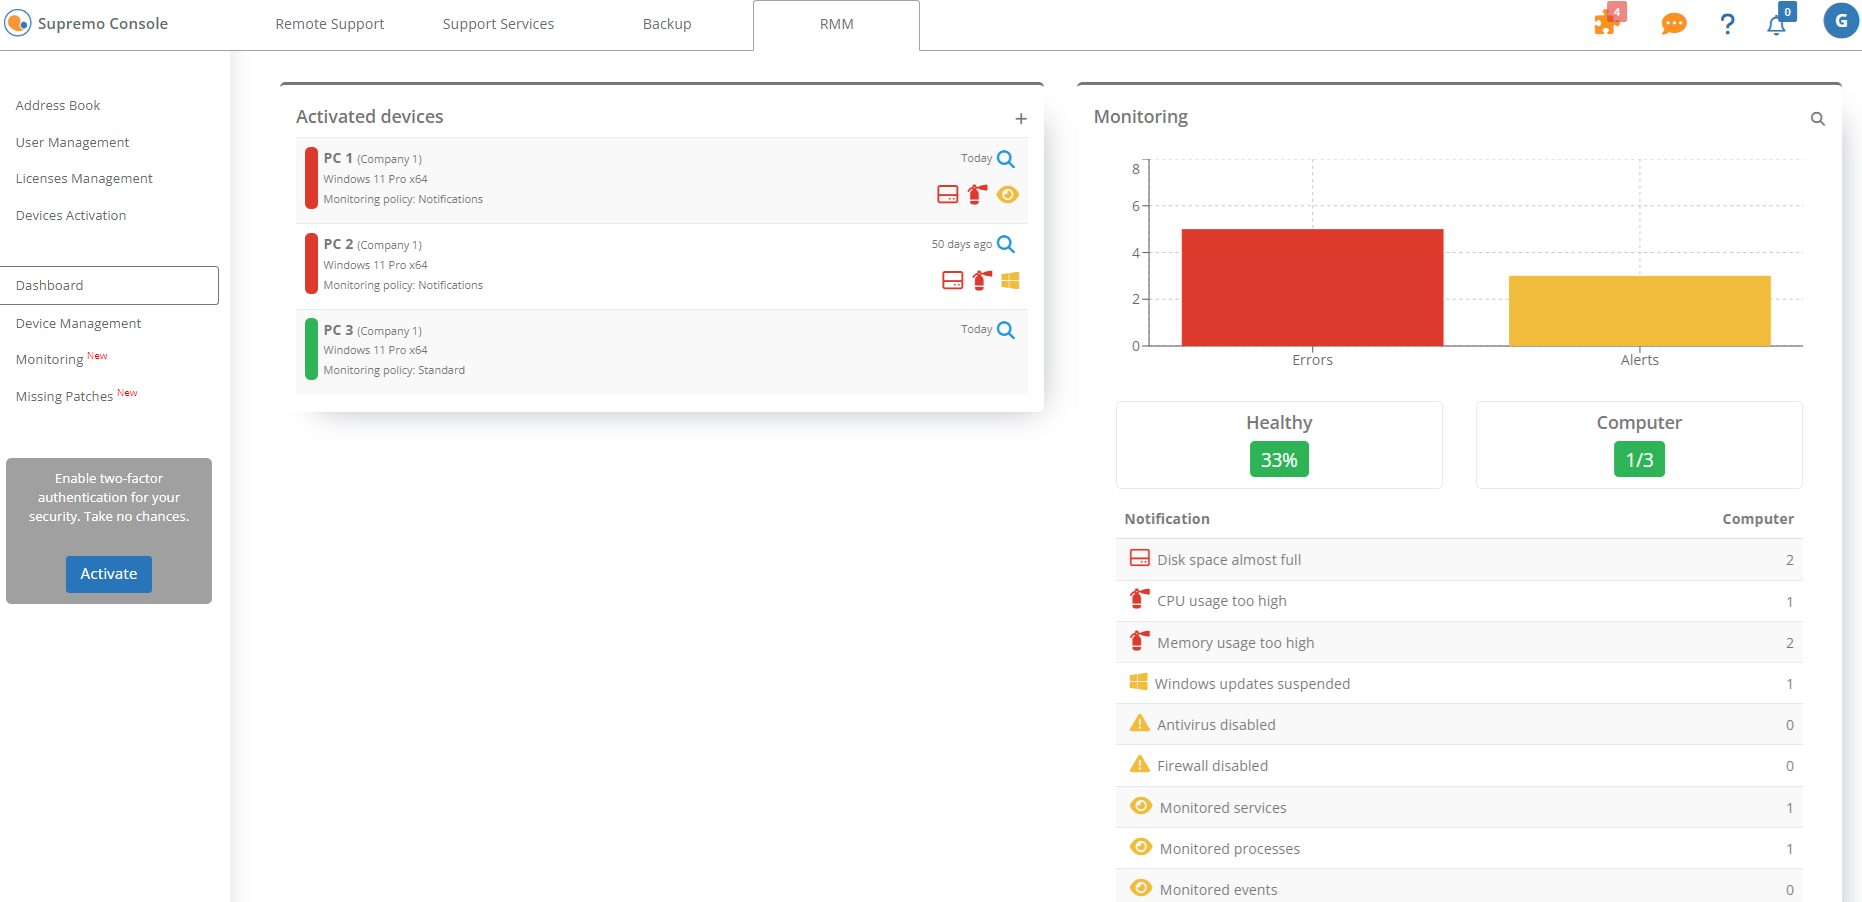
In the Dashboard you have a convenient control panel that you can use to quickly and easily check the general status of the machines you manage, with evidence of those that have performance or security issues.
The Dashboard has two sections:
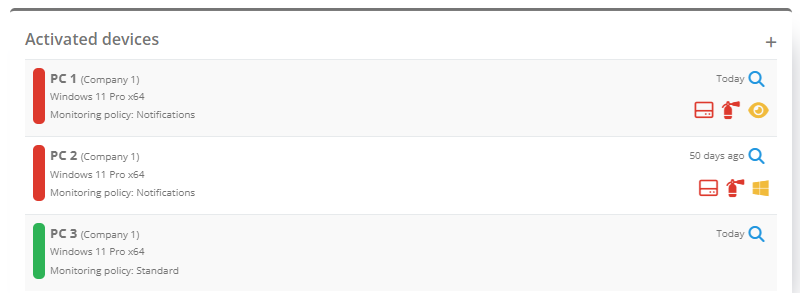
- on the left of the page, you find Activated devices: this is a preview of the devices associated with your account Supremo Console and for which you have activated the Device Management at the link Devices Activation.
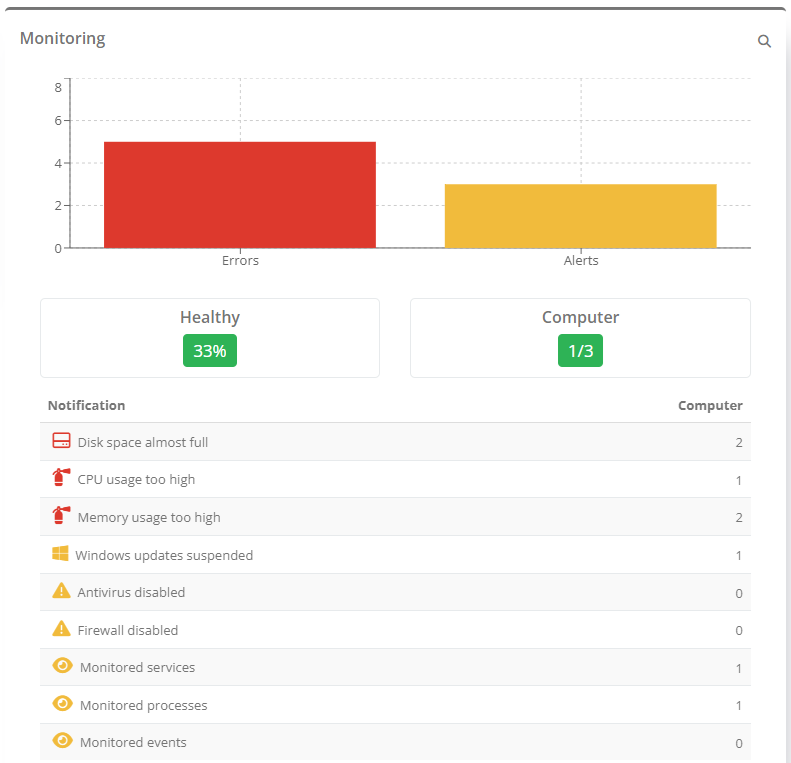
- on the right of the page you find Monitoring: a preview of the health of the machines and of any notifications in progress. The information refers to the devices associated with your account Supremo Console and for which you have activated the Monitoring feature at the link Devices Activation. The health status shown in the Dashboard is calculated based on the monitoring policy assigned to each device.
In the RMM section you can find two types of notifications; those for errors, relating to performance issues, and warnings, relating to security issues, as well as monitoring of services, processes and events. Thanks to this distinction, you can quickly identify which devices require immediate attention, perhaps remotely, and then plan your support accordingly.
N.B: The Device Management and Monitoring functions make it possible to set separate activations for each device: you can decide for which devices you want to access the Device Management information, for which to activate Monitoring notifications, and for which to use both functions.
After logging in to the Supremo Console in the Tools – Professional Supremo section, you have to go to the Devices Activation link and activate the administration of the device first, and then the individual functions you want. For more details, click here.

In the first section, Activated devices, for each device you can check:
- the Address Book group it belongs to
- the operating system installed
- the monitoring policy assigned
- the types of notifications in progress, if any, shown by the identification icons
- how many days the device has been the status you see
With the indicator on the left of the machine name, you can check the health status of your devices at a glance: the indicator is green if the device is in good health, red if it has error notifications, or yellow if there are any warning notifications.
Also, it is possible to filter by Group in order to check the health status of a specific company or department (for example).
A grey indicator indicates that Monitoring has not been activated (at the Devices Activation link) for the computer in question. For these machines Monitoring not active is shown.
By clicking on the + symbol you are redirected to the Devices Activation page.

In the Monitoring section, you can consult the general status of your devices and immediately check the percentage and number of devices in good health, compared to the total number of devices for which Monitoring is active.
You then have summary data on all the notifications in progress: the histogram chart shows you the number of error or warning notifications in progress, while in the section below you can check, for each type of notification, the number of devices affected.

By clicking on the magnifying glass you can access the global monitoring, where you can view all the notifications in progress and the notification history, and can use customised search filters by device or by type of notification.
By clicking on a computer name, you can access monitoring data for that machine directly.
For more information, click here.

 Français
 Deutsch
 Italiano
 Português
 Español